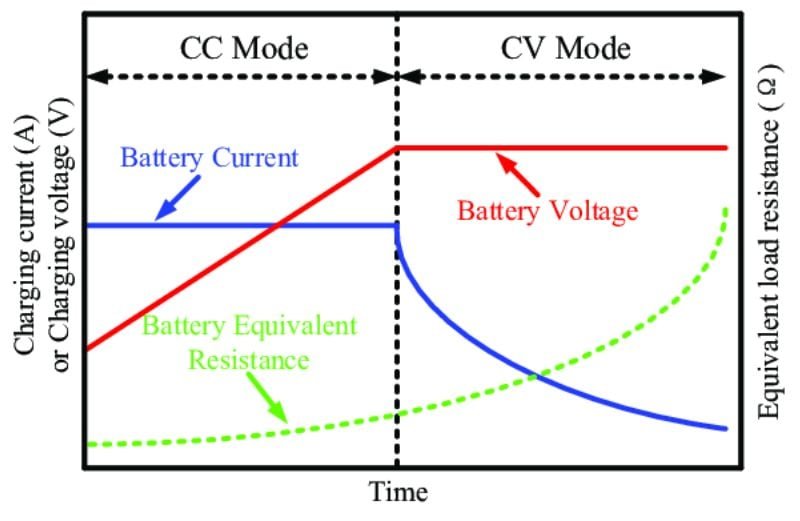
An EV charging curve shows how charging speed changes as an electric vehicle battery fills up.
When people ask What Is EV Charging Curve, they are usually trying to understand why their EV does not charge at the same speed from 10% to 100%. The charging speed often starts high, then gradually drops as the battery reaches a higher state of charge.
From years of studying EV technology and charging behavior, one key lesson is that charging time depends on more than the charger rating. The vehicle battery, temperature, software, and battery management system all shape the charging curve.

What Is EV Charging Curve and How Does It Work?
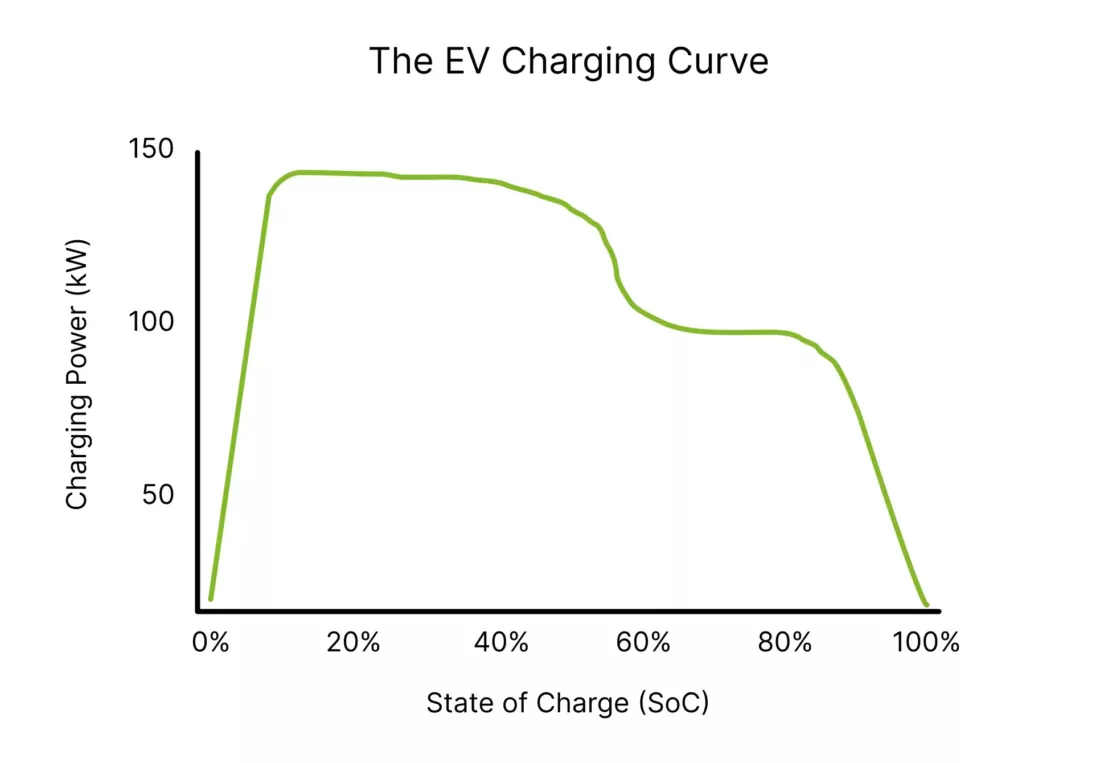
An EV charging curve is a graph that shows the relationship between battery charge level and charging power. The horizontal line usually shows the battery state of charge, while the vertical line shows charging power in kilowatts.
The curve explains why an electric vehicle may accept 150 kW at a low battery level but only 40 kW when the battery is almost full. This change is normal and happens because the battery needs more control as it fills.
- ✦ Early charging stage
A battery can often accept high power when its charge level is low because there is more room for incoming energy.
- ✦ Middle charging stage
The vehicle may maintain strong charging power for a period before reducing speed.
- ✦ Final charging stage
Charging slows near full capacity to reduce heat and protect battery life.
Why Charging Speed Is Not Constant
Many new EV owners expect a 250 kW charger to deliver 250 kW during the entire session. In reality, the vehicle controls the power it accepts, not only the charger.
The battery management system adjusts charging power based on safety limits, temperature, and battery condition.
Why EV Charging Curves Drop at Higher Battery Levels
The main reason charging power decreases is battery protection. Lithium-ion batteries create more heat and stress when they receive high energy levels near full capacity.
To prevent damage, EV manufacturers reduce charging power as the battery approaches 80% or higher. This process helps improve long-term battery reliability.

- ✦ Heat control
Lower charging power reduces battery temperature and keeps the charging process safer.
- ✦ Battery protection
A slower final charging stage reduces stress on battery cells.
- ✦ Cell balancing
The battery system adjusts power to keep individual cells balanced.
The Role of Battery Management Systems
The battery management system acts like the brain of an EV battery pack. It monitors voltage, temperature, and cell performance during charging.
When conditions change, it adjusts the charging curve to maintain safety and battery health.
Different Types of EV Charging Curves
Not every electric vehicle has the same charging curve. Some models keep high charging power for longer, while others reduce power earlier.
The battery size, battery chemistry, software tuning, and cooling system all affect how a vehicle charges.

- ✦ Flat charging curve
Some EVs maintain similar charging power over a wide battery range, reducing charging time.
- ✦ Sharp drop curve
Some vehicles reduce power quickly after reaching a certain battery level.
- ✦ Optimized curve
Many modern EVs balance speed and battery protection with a controlled charging pattern.
How Charging Curves Affect Real-World EV Charging Time
Charging curves explain why adding the first 50% of battery power is often much faster than adding the last 20%. Drivers who understand this can plan shorter charging stops.
For highway trips in the United States, many EV owners stop at fast chargers only long enough to reach a practical driving range instead of waiting for a full charge.
- ✦ Charge during the fastest range
Many drivers save time by charging before the battery reaches very high levels.
- ✦ Use route planning tools
Modern EV navigation systems can suggest charging stops based on battery needs.
Why 80% Charging Is Often Recommended
The last part of charging usually takes much longer because the vehicle reduces power. For daily driving, many owners do not need a full charge every day.
Stopping around 80% can provide a good balance between travel time and usable driving range.
Factors That Change an EV Charging Curve
The charging curve of an EV can change depending on many conditions. Two charging sessions with the same vehicle can have different results.
Understanding these factors helps drivers get more predictable charging performance.

- ✦ Battery temperature
Cold or very hot batteries may reduce charging power until the temperature reaches a better range.
- ✦ Battery state of charge
The current battery percentage has a major effect on charging speed.
- ✦ Charger capability
A powerful charger cannot force a vehicle to accept more energy than its system allows.
- ✦ Vehicle software
Software updates can improve how an EV manages charging performance.
Cold Weather and Charging Curves
Cold temperatures can slow charging because battery cells work less efficiently. Many EVs use battery preconditioning to warm the pack before fast charging.
This feature helps the vehicle reach a better charging curve during winter trips.
How EV Owners Can Get Faster Charging Results
Knowing What Is EV Charging Curve helps drivers make smarter charging choices. Small changes in charging habits can save time during daily use and long trips.
The best charging strategy depends on your driving needs, vehicle model, and access to charging stations.
- ✦ Start with a lower battery level
Fast chargers usually work best when the battery is not already near full.
- ✦ Precondition the battery
Use built-in navigation or charging preparation features when available.
- ✦ Avoid unnecessary full charges
Charging to 100% often takes much longer because of the final slow stage.