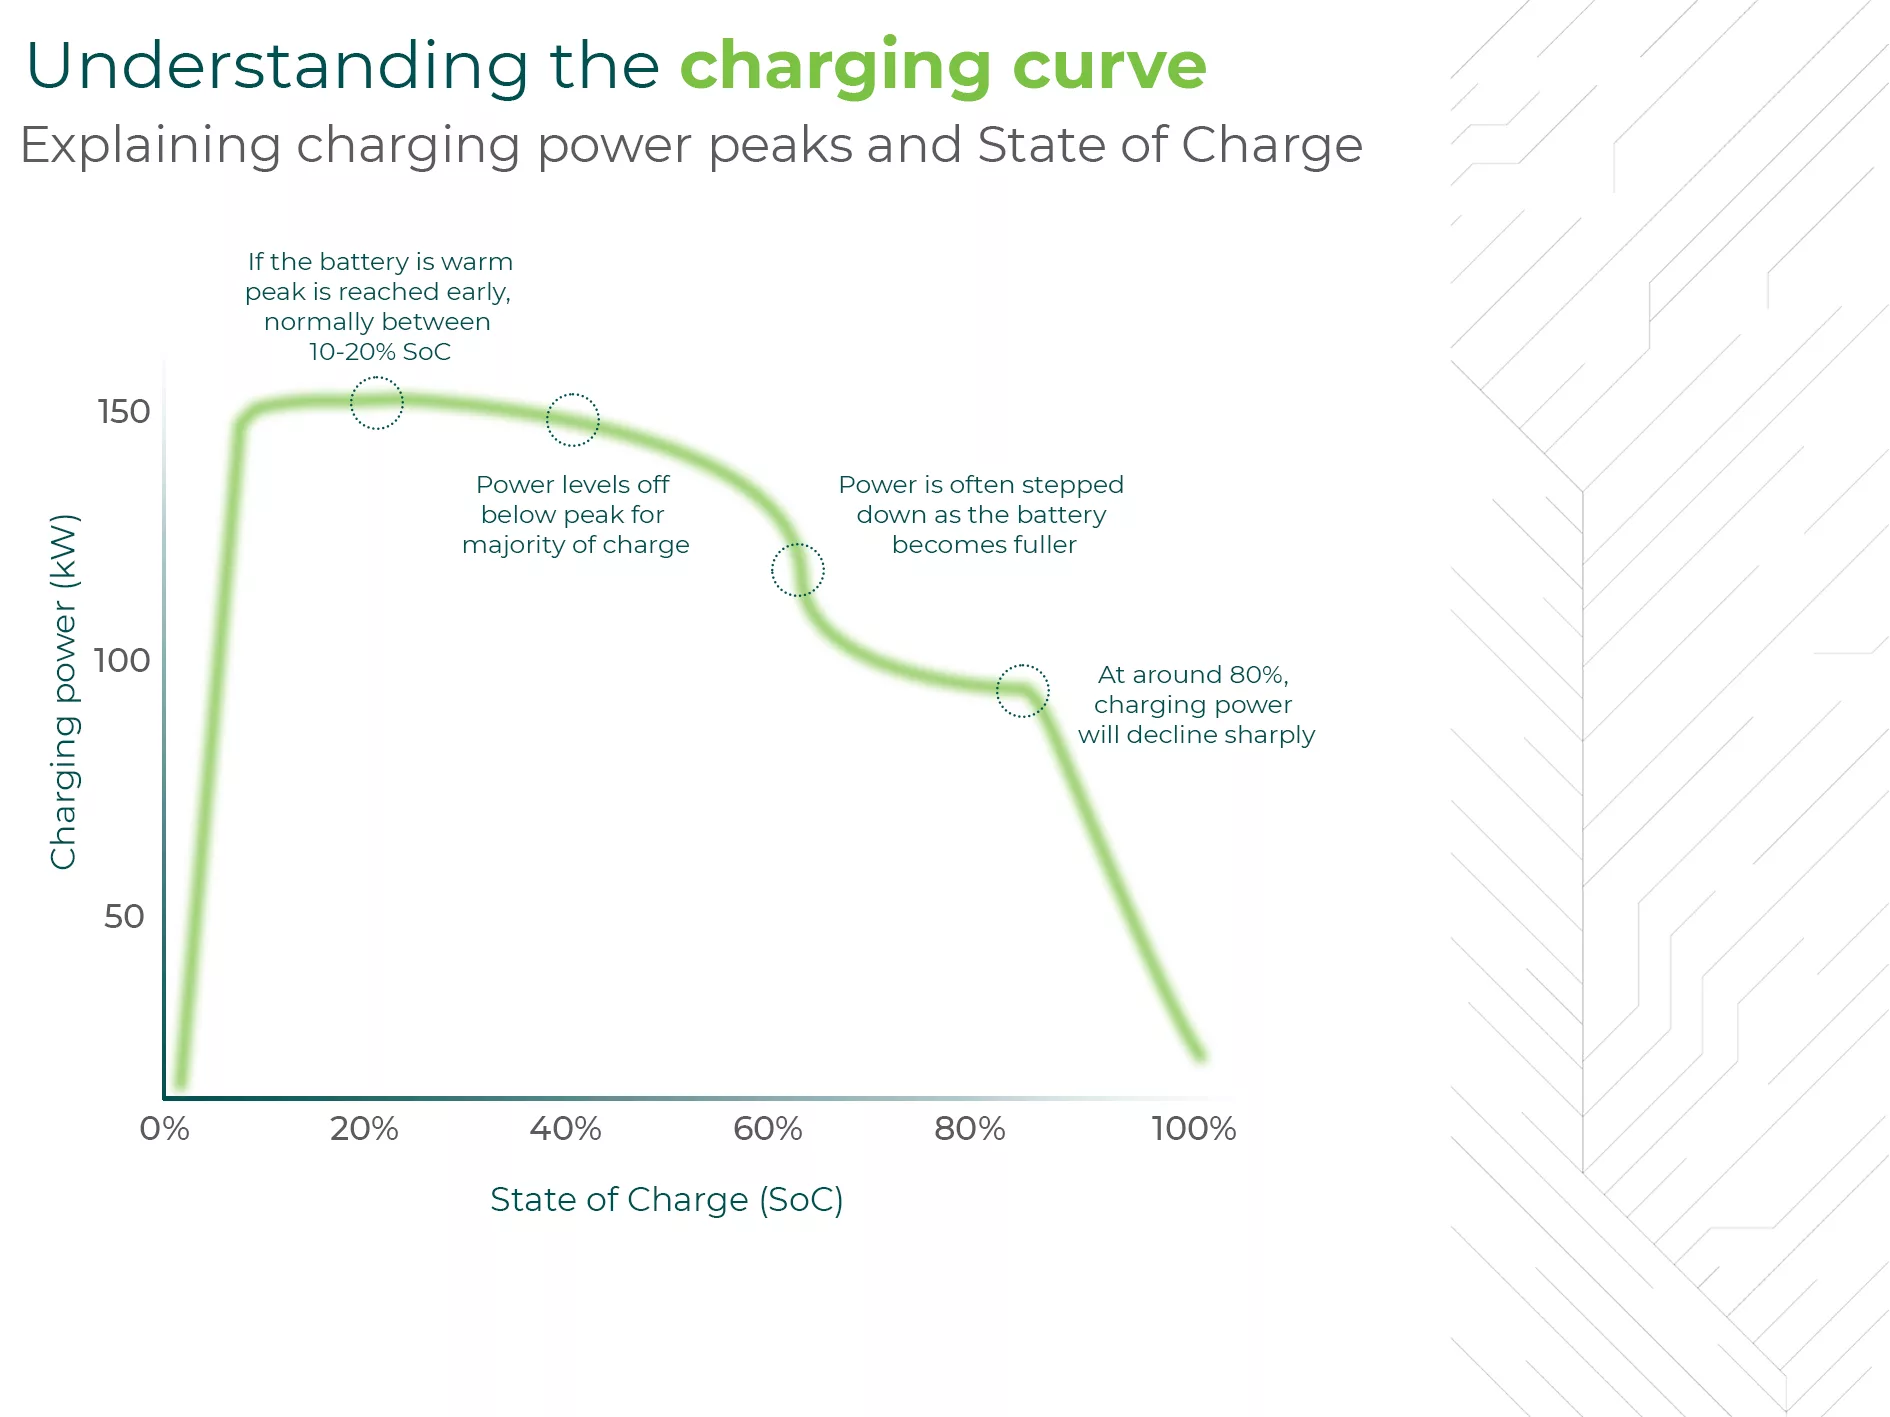
Many EV drivers expect charging time to stay constant from empty to full. In reality, electric vehicles do not charge at the same speed during the entire session. The battery management system changes power flow based on battery temperature, charge level, and battery safety limits.
Understanding How EV Charging Curves Affect Charging Time helps drivers in the United States make better choices at home chargers and public fast charging stations. After studying EV charging behavior, one common lesson is clear: adding the first 70% of battery charge is often much faster than adding the final 30%.

What Is an EV Charging Curve?
An EV charging curve is a graph that shows how much charging power an electric vehicle accepts over time. It usually compares battery state of charge with charging speed measured in kilowatts (kW).
The curve explains why a vehicle may accept 150 kW during the early part of a DC fast charging session but reduce power later. This change protects the battery and improves long-term battery health.

- ✦ Battery State of Charge
The percentage of battery capacity already filled has a major effect on charging speed.
- ✦ Charging Power
Charging power shows how quickly energy enters the battery at a specific moment.
- ✦ Battery Protection
The vehicle reduces power when needed to prevent excess heat and battery stress.
Why Charging Curves Are Not Straight Lines
A simple charger does not always deliver the same power until the battery reaches 100%. Lithium-ion batteries need careful control during charging. The vehicle adjusts power because battery cells become less able to accept high energy flow when they are nearly full.
How EV Charging Curves Affect Charging Time
How EV Charging Curves Affect Charging Time depends on where the battery starts and how much charge the driver needs. A vehicle starting at 10% battery can often charge quickly because the battery can accept high power.
When the battery reaches around 70% to 80%, many EVs begin reducing charging power. This means the final part of charging can take much longer than the first part.

- ✦ Low Battery Level
The battery can usually accept higher charging speeds because there is more room for stored energy.
- ✦ Middle Charging Range
Many EVs reach their highest charging performance during this stage.
- ✦ High Battery Level
Charging slows to protect battery cells and maintain safety.
Why 80% Charging Is Common During Road Trips
Many EV drivers stop charging around 80% during long trips because the last 20% often takes more time. Adding enough energy for the next part of the journey can be more efficient than waiting for a complete charge.
The Different Stages of an EV Charging Curve
Most EV charging curves have three main stages. Each stage represents a different relationship between battery level and charging speed.
These stages explain why two charging sessions with the same charger can have different completion times.

- ✦ Initial Charging Stage
The vehicle accepts high power when the battery has low charge and conditions are suitable.
- ✦ Constant Power Stage
The vehicle maintains strong charging speed before reaching higher battery levels.
- ✦ Tapering Stage
The vehicle gradually reduces charging power as the battery approaches full.
How Battery Temperature Changes the Curve
Temperature plays a major role in EV charging speed. A cold battery may limit charging power until it reaches a better operating temperature. Many modern EVs use battery preconditioning before fast charging to improve performance.
- ✦ Cold Conditions
Cold batteries often charge slower because chemical reactions inside the cells happen more slowly.
- ✦ Warm Conditions
A battery at the right temperature can accept energy more efficiently.
How DC Fast Charging Uses Charging Curves
DC fast chargers are designed for quick energy delivery, but the vehicle controls how much power it receives. The charger may offer high output, but the EV battery decides the actual charging speed.
How EV Charging Curves Affect Charging Time is especially important at public fast chargers across the United States. A powerful charger does not always mean a faster charging session if the vehicle reduces power during the session.

- ✦ Charger Capability
A higher-rated charger can provide more power when the vehicle supports it.
- ✦ Vehicle Limits
Battery design and software determine the maximum charging speed.
Factors That Change an EV Charging Curve
Every electric vehicle has a unique charging curve. Battery size, battery chemistry, software settings, and charging conditions can all change how quickly an EV charges.
Drivers should look at real charging performance instead of only comparing charger power ratings.

- ✦ Battery Chemistry
Different battery types have different charging characteristics and power limits.
- ✦ Battery Size
Large batteries may store more energy but can have different charging patterns.
- ✦ Software Updates
Manufacturers can improve charging behavior through software changes.
How Drivers Can Reduce EV Charging Time
Drivers can use charging curve knowledge to reduce wasted time. Planning charging stops around the fastest part of the curve often creates a better experience.
For daily driving in the US, home charging overnight usually avoids the need to chase maximum charging speed. Fast charging is most useful for longer trips.

- ✦ Start Charging Before the Battery Is Very Low
A moderate battery level can help maintain faster charging performance during trips.
- ✦ Precondition the Battery
Preparing the battery before arrival at a fast charger can improve charging speed.
- ✦ Avoid Waiting for 100%
Charging to full capacity may take much longer because of the final charging slowdown.